
Allele Frequency Calculator
Find allele and genotype frequencies and test Hardy-Weinberg equilibrium.
Your Results
Enter your values and press Calculate to see your results.
What Is a Allele Frequency Calculator?
An allele frequency calculator works out how common each version of a gene is in a population. From simple genotype counts it calculates the frequency of the dominant allele (p) and the recessive allele (q), compares the observed genotypes with those expected under Hardy-Weinberg equilibrium, and runs a chi-square test to show whether the difference is statistically significant.
A second mode estimates allele and carrier frequencies from the proportion of people or animals showing a recessive trait – a classic exercise in genetics classes and a quick way to estimate how many individuals carry a hidden recessive allele.
How to Use the Allele Frequency Calculator
- Choose From Genotype Counts if you know how many AA, Aa and aa individuals you have.
- Enter the three counts and press Calculate.
- Read p, q, the observed and expected genotype numbers, the chi-square value and the p-value.
- Use From Recessive Phenotype when you only know the frequency of the recessive trait (q²).
- Enter q² as a decimal or percentage to get q, p and the carrier frequency (2pq).
Allele Frequency and Hardy-Weinberg Formulas
Each individual carries two copies of a gene, so a sample of N individuals contains 2N alleles. The allele frequency calculator counts them directly.
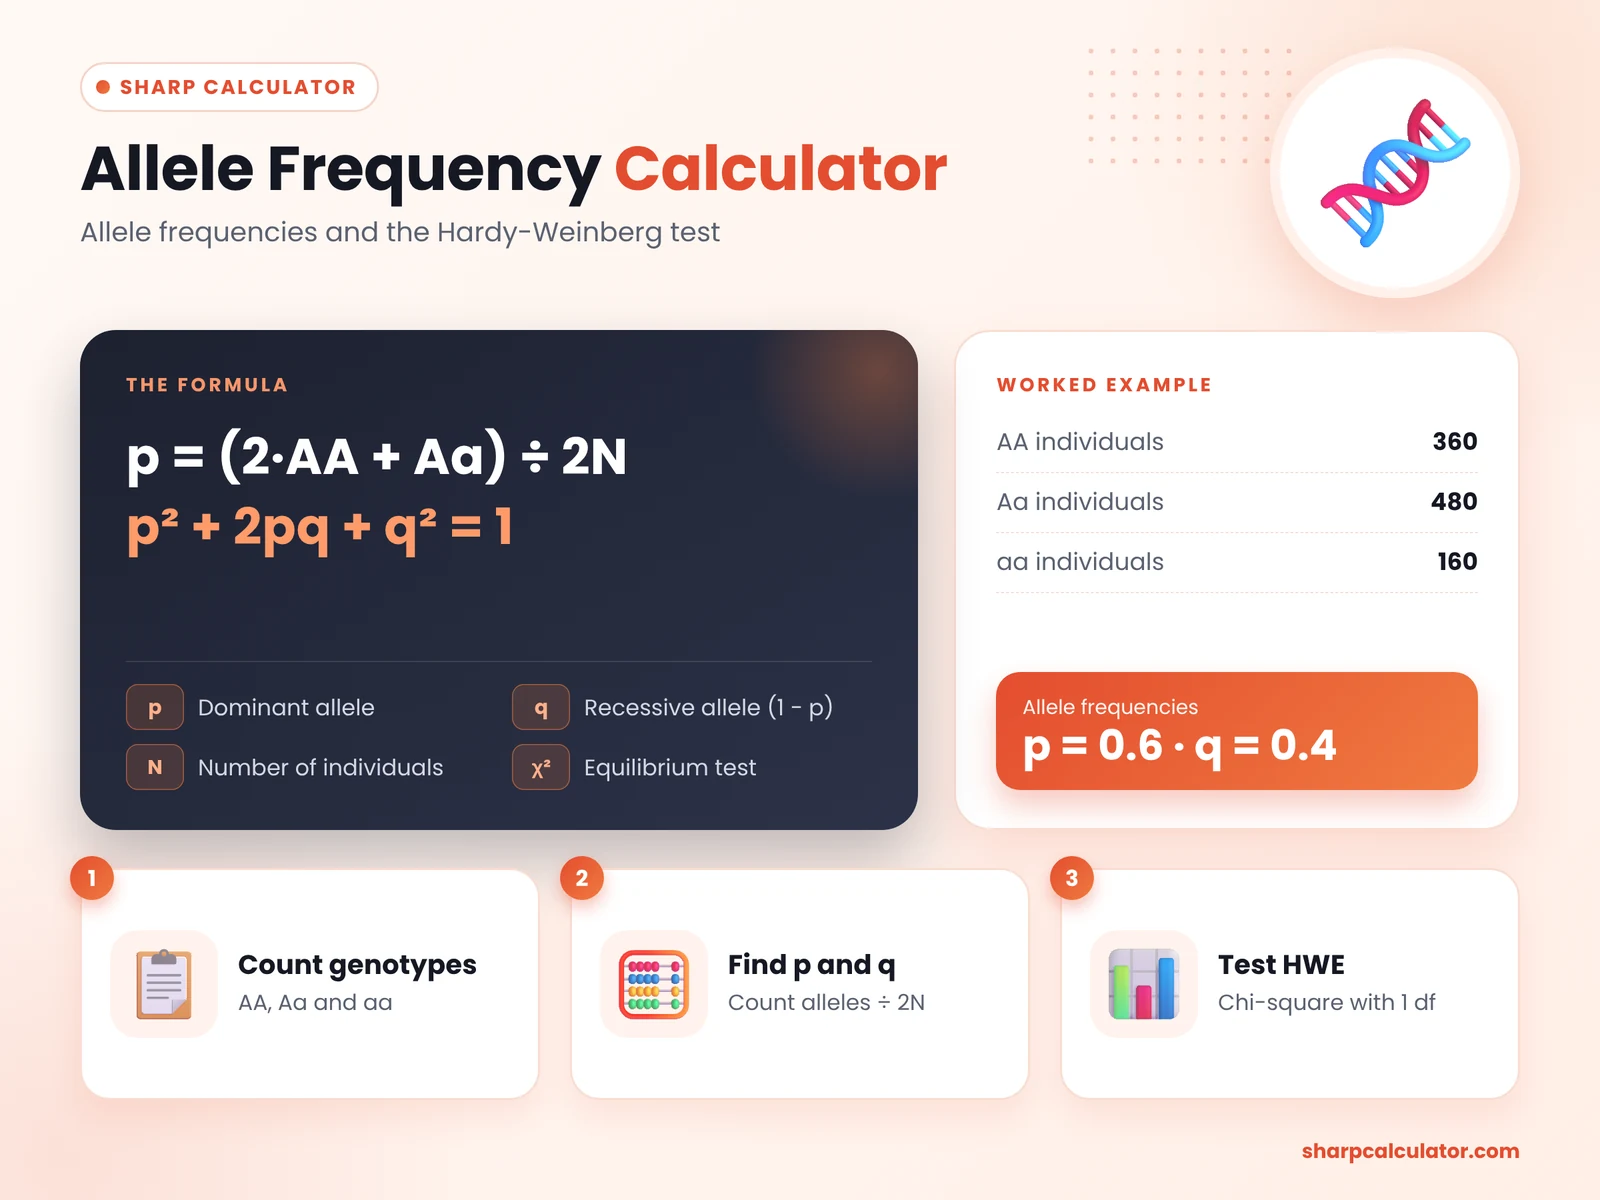
p = (2·AA + Aa) ÷ 2N q = 1 − pp² + 2pq + q² = 1- p – frequency of the dominant allele A
- q – frequency of the recessive allele a
- p², 2pq, q² – expected AA, Aa and aa frequencies
- χ² = Σ (O − E)² ÷ E with 1 degree of freedom
If χ² is greater than 3.841, the p-value is below 0.05 and the population is unlikely to be in Hardy-Weinberg equilibrium. That can point to selection, inbreeding, migration, genetic drift or genotyping errors.
Worked example
A sample of 1,000 individuals has 360 AA, 480 Aa and 160 aa.
p = (2 × 360 + 480) ÷ 2,000 = 0.6 and q = 0.4. Expected counts are 360, 480 and 160, so χ² = 0 and the population fits Hardy-Weinberg equilibrium perfectly.

Hardy-Weinberg Assumptions
The Hardy-Weinberg principle predicts stable allele and genotype frequencies from one generation to the next, but only under ideal conditions. Real populations rarely meet every condition, which is exactly why the equilibrium test is useful: a significant deviation tells you something interesting may be happening.
Even when a population is not in perfect equilibrium, Hardy-Weinberg expectations remain a useful baseline. Comparing observed and expected numbers shows researchers where to look for forces such as selection, inbreeding or migration that may be changing the population over time.
In small or isolated populations these assumptions are broken most often. Island animals, rare livestock breeds and closed laboratory colonies can drift away from equilibrium within a few generations, and inbreeding raises the proportion of homozygous individuals. That is why conservation programmes track genotype frequencies regularly and plan matings to keep heterozygosity as high as possible. Modern genotyping makes it easy to collect the counts needed for this test, and running it on each new generation shows quickly whether breeding or management decisions are changing the genetic make-up of a herd, flock or population.
| Assumption | What breaks it |
|---|---|
| Random mating | Inbreeding, assortative mating |
| No natural selection | Genotypes with different survival |
| No mutation | New alleles arising |
| No migration | Gene flow between populations |
| Very large population | Genetic drift in small groups |
Estimating Carrier Frequency
For recessive conditions, affected individuals are q², but carriers (2pq) are far more common. If 1 in 2,500 people shows a recessive trait, q = √0.0004 = 0.02 and the carrier frequency is about 3.9%, or roughly 1 in 26 people. This is why recessive alleles can persist in a population even when the trait itself is rare.
Real-World Uses of Allele Frequencies
Dog and cattle breeders track the frequency of disease alleles to plan matings that avoid affected offspring. Public health researchers estimate how many people carry alleles for conditions such as cystic fibrosis or sickle cell disease. Conservation programmes compare allele frequencies between populations to measure genetic diversity and detect inbreeding. In each case the starting point is the same simple counting method used in this calculator.
Tips for Accurate Results
- Use counts, not percentages.For the chi-square test, enter the actual number of individuals in each genotype class.
- Check sample size.Expected counts below 5 make the chi-square test unreliable; collect more data if possible.
- Know your dominance.Genotype counts require that heterozygotes can be identified, for example by DNA testing.
- Remember assumptions.The carrier estimate assumes Hardy-Weinberg equilibrium and random mating.
- Round at the end.Keep full precision during calculations and only round the final answer.
- Interpret p-values carefully.A non-significant result means no detectable deviation, not proof of perfect equilibrium.
Why Allele Frequencies Matter
Allele frequencies are the basic currency of population genetics. They help breeders manage genetic diseases, conservation biologists monitor small populations, epidemiologists estimate carrier risk and students understand how evolution changes populations over time. An allele frequency calculator turns raw genotype data into these numbers in seconds and checks whether the population behaves as Hardy-Weinberg predicts.
Who Can Use This Tool?
This tool is ideal for high school and university biology students, genetics teachers, animal and plant breeders, and researchers analysing genotype data. It works on any device without installation.
Note: This allele frequency calculator is an educational and research planning tool. It is not intended for clinical genetic counselling.
Frequently Asked Questions
How do you calculate allele frequency?
Count the alleles: p = (2 × AA + Aa) ÷ (2 × total individuals). The other allele frequency is q = 1 − p.
What is the Hardy-Weinberg equation?
p² + 2pq + q² = 1, where p² is the AA frequency, 2pq is the Aa frequency and q² is the aa frequency.
How do I know if a population is in Hardy-Weinberg equilibrium?
Compare observed and expected genotype counts with a chi-square test. A χ² above 3.841 (p < 0.05, 1 df) indicates a significant deviation.
How do I find carrier frequency from a recessive trait?
Take the square root of the trait frequency to get q, calculate p = 1 − q, then multiply 2 × p × q.
Why is there only one degree of freedom?
There are three genotype classes, minus one for the total and one for the estimated allele frequency, leaving 1 degree of freedom.
Can I use this calculator for more than two alleles?
This version handles one gene with two alleles. Multi-allele systems such as blood groups need an extended calculation.