
Protein Concentration Calculator
Convert absorbance into protein concentration in mg/mL and µM.
Your Results
Enter your values and press Calculate to see your results.
What Is a Protein Concentration Calculator?
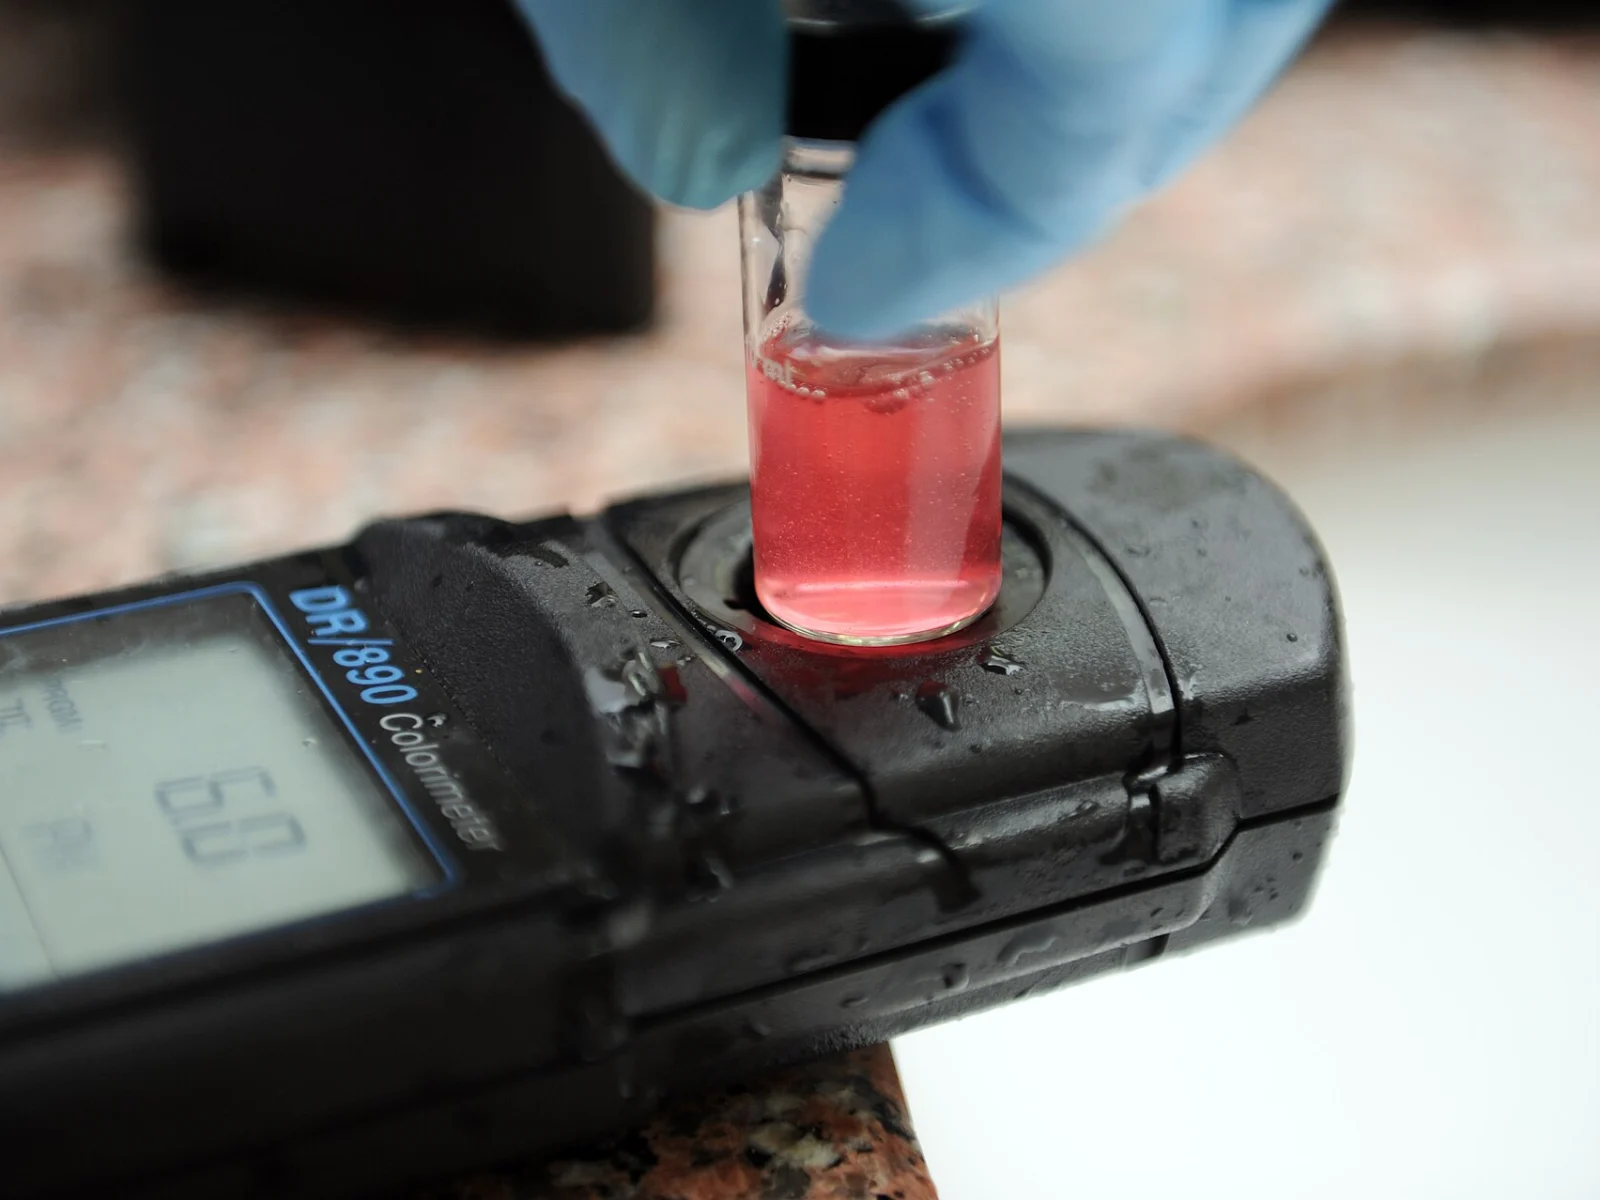
A protein concentration calculator converts an absorbance reading into the amount of protein in your sample. The most common method uses UV absorbance at 280 nm, where tryptophan and tyrosine residues absorb light, together with the Beer-Lambert law. Colorimetric assays such as BCA and Bradford instead rely on a standard curve made with known protein amounts.
This tool supports all three approaches: A280 with a molar extinction coefficient, A280 with a mass extinction coefficient (E1%), and a standard-curve calculation for BCA or Bradford results. Each mode applies your dilution factor and shows the working, so you can check the math in your lab notebook.
How to Use the Protein Concentration Calculator
- Pick the tab that matches your method: extinction coefficient, E1% or standard curve.
- Enter your blank-corrected absorbance.
- Add the extinction coefficient and molecular weight, the E1% value, or your curve slope and intercept.
- Enter the path length (1 cm for a standard cuvette) and any dilution factor.
- Press Calculate to get mg/mL, µg/mL and molar concentration.
Beer-Lambert Law for Protein Concentration
The protein concentration calculator is built on the Beer-Lambert law, which states that absorbance is proportional to concentration and path length.
A = ε × c × l → c = A ÷ (ε × l)- A – absorbance at 280 nm (no units)
- ε – molar extinction coefficient (M⁻¹cm⁻¹)
- c – molar concentration (M)
- l – path length (cm)
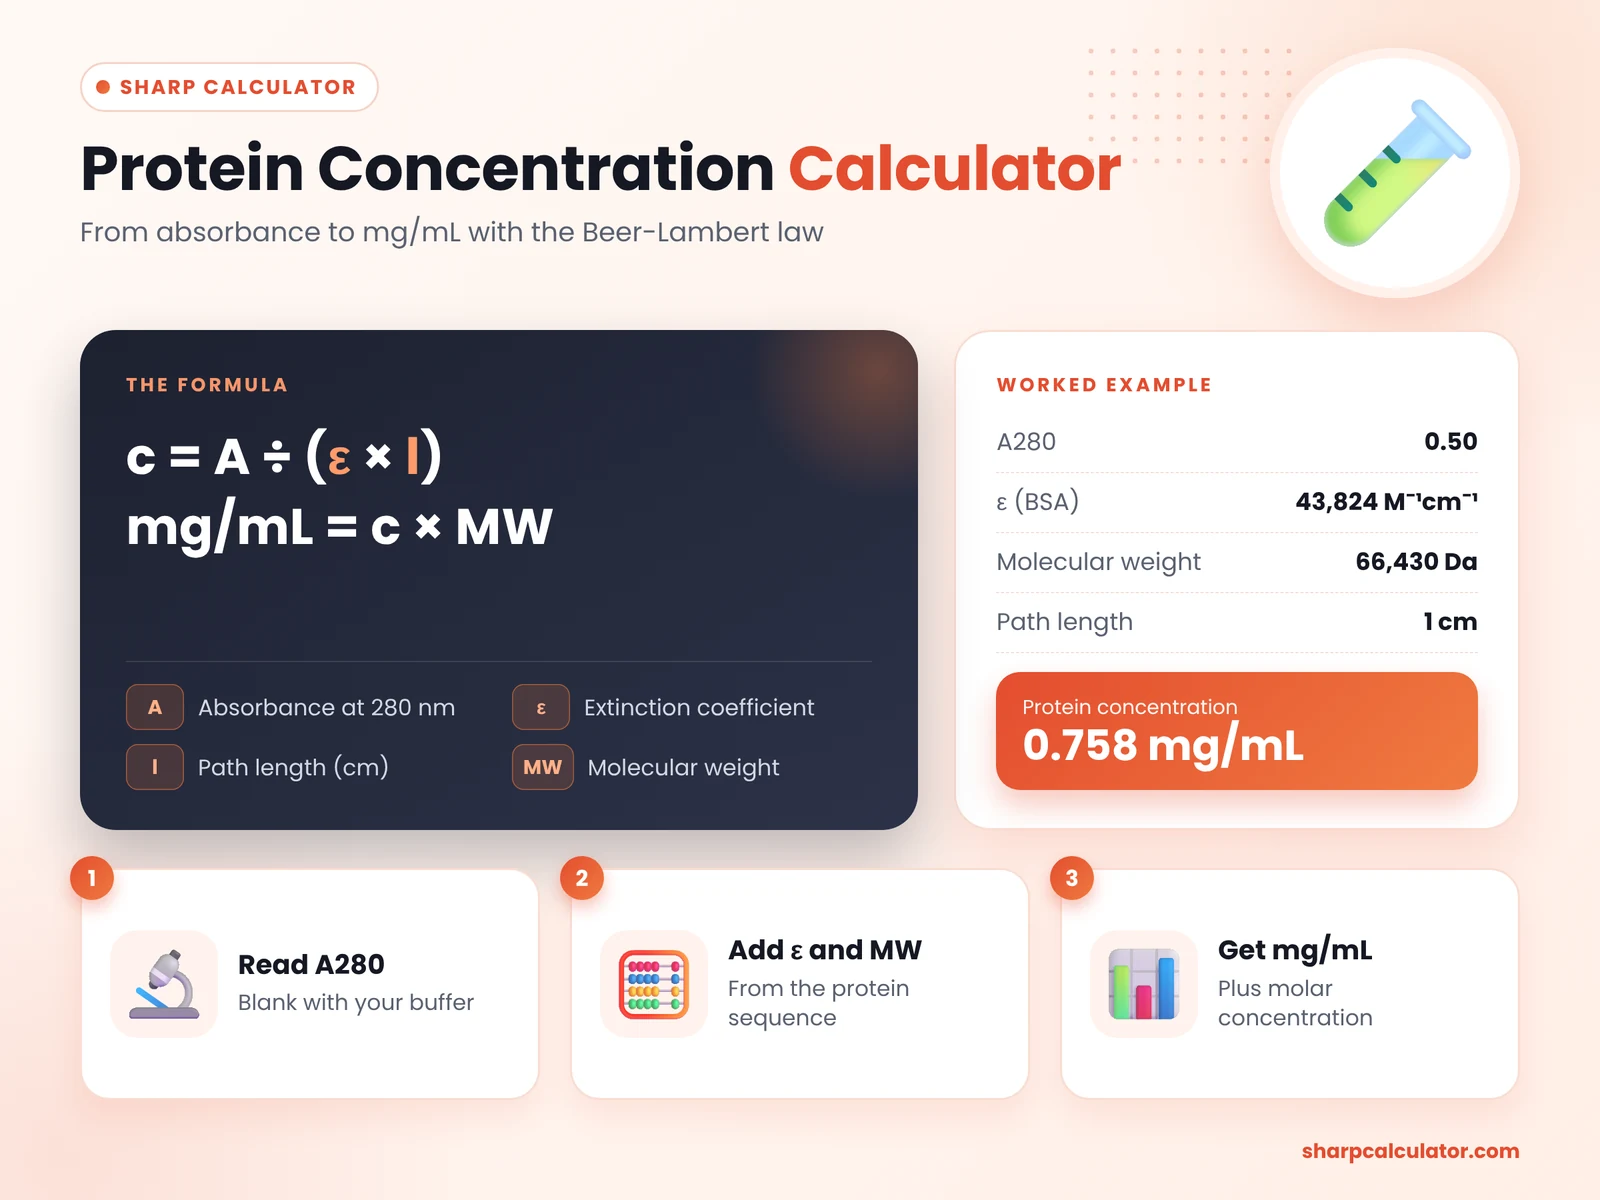
Multiply the molar result by the molecular weight to get mg/mL. With an E1% value (absorbance of a 10 mg/mL solution), use mg/mL = A280 × 10 ÷ E1%. For a standard curve, concentration = (A − intercept) ÷ slope.
Worked example
A bovine serum albumin (BSA) sample reads A280 = 0.50 in a 1 cm cuvette. BSA has ε = 43,824 M⁻¹cm⁻¹ and a molecular weight of 66,430 Da.
c = 0.50 ÷ 43,824 = 1.14 × 10⁻⁵ M, or 11.4 µM. Multiply by 66,430 g/mol to get 0.758 mg/mL.
Which Protein Assay Should You Use?
A280 is fast, needs no reagents and leaves the sample intact, but it requires a pure protein and a known extinction coefficient. Nucleic acids absorb strongly at 260 nm and can inflate A280, so check the A260/A280 ratio.
BCA and Bradford assays are better for mixtures such as cell lysates. BCA tolerates many detergents, while Bradford is quick but more sensitive to protein composition. Always run standards in the same buffer as your samples.
Whichever method you choose, consistency matters. Use the same assay, standard protein and instrument for samples you want to compare, and record the method alongside each result. BSA is the most common standard, but bovine gamma globulin can give closer values for antibody samples. When very accurate values are needed, such as for enzyme kinetics or crystallisation, A280 with a sequence-based extinction coefficient on a purified protein is usually the most dependable choice. Running samples and standards in duplicate or triplicate and averaging the readings also reduces random error and gives you more confidence in the final value.
| Method | Typical range | Best for |
|---|---|---|
| A280 (UV) | 0.1 – 100 mg/mL | Purified proteins |
| BCA | 20 – 2,000 µg/mL | Lysates, detergent buffers |
| Bradford | 1 – 1,500 µg/mL | Quick estimates |
| Lowry | 5 – 100 µg/mL | Older protocols |
Common Sources of Error in Protein Measurements
Most protein concentration errors come from the sample rather than the formula. Turbid samples scatter light and raise absorbance at every wavelength, so spin them down or filter before measuring. Buffers containing imidazole, DTT, Triton X-100 or high nucleotide levels can absorb near 280 nm and must be matched in the blank. In colorimetric assays, reducing agents interfere with BCA, while detergents and very basic buffers disturb the Bradford dye.
Another frequent mistake is using an extinction coefficient for the wrong protein form. Disulfide bonds (cystines) add absorbance, so the oxidised and reduced forms have slightly different ε values. Tagged proteins also differ from the native sequence, so calculate ε for the exact construct you purified.
Tips for Accurate Results
- Blank with your buffer.Zero the spectrophotometer with the exact buffer the protein is in.
- Stay in the linear range.A280 readings between 0.1 and 1.0 are most reliable; dilute samples that read higher.
- Use the right ε value.Calculate ε from the protein sequence; it changes with tryptophan, tyrosine and cystine content.
- Check purity.An A260/A280 ratio above ~0.6 suggests nucleic acid contamination.
- Measure in replicate.Average two or three readings to reduce pipetting and instrument noise.
- Match standards to samples.For BCA or Bradford, prepare standards in the same buffer and read them on the same plate.
Why Accurate Protein Concentration Matters
Protein concentration feeds into almost every downstream step: loading equal amounts on a western blot, setting up enzyme assays, preparing crystallisation trials or dosing cells. A small error at this stage spreads through every experiment that follows. A reliable protein concentration calculator removes arithmetic slips, applies dilution factors consistently and gives results in the units you need.
Who Can Use This Tool?
The calculator is useful for biochemistry and biotechnology students, protein purification scientists, lab technicians and teachers explaining the Beer-Lambert law. It runs in any browser, on mobile or desktop, with no sign-up.
Note: This protein concentration calculator is intended for research and educational use. Results depend on the accuracy of your absorbance readings and extinction coefficients.
Frequently Asked Questions
How do you calculate protein concentration from A280?
Divide the absorbance by the molar extinction coefficient and path length (c = A ÷ ε × l) to get molar concentration, then multiply by molecular weight for mg/mL.
What if I do not know the extinction coefficient?
Use the E1% tab with a value of 10. This assumes an A280 of 1.0 equals about 1 mg/mL, a rough estimate for many proteins.
What is E1% for a protein?
E1% is the absorbance of a 1% (10 mg/mL) protein solution in a 1 cm cuvette. BSA is about 6.6 and IgG about 13.7.
Can I use this calculator for a Bradford or BCA assay?
Yes. Fit a straight line to your standards, then enter the slope, intercept and sample absorbance in the standard-curve tab.
Why is my A280 result too high?
Nucleic acid contamination, light scattering from aggregates or an incorrect blank can raise A280. Check the A260/A280 ratio and centrifuge cloudy samples.
What dilution factor should I enter?
Enter how many times the sample was diluted before measuring. A 1 : 10 dilution has a dilution factor of 10.