
qPCR Efficiency Calculator
Turn your standard curve into PCR amplification efficiency.
Your Results
Enter your values and press Calculate to see your results.
What Is a qPCR Efficiency Calculator?
A qPCR efficiency calculator tells you how well your primers and reaction double the target DNA in each PCR cycle. At 100 % efficiency, the amount of product exactly doubles every cycle. Real reactions usually fall a little below or above this, and knowing the true value is essential for accurate quantification, primer validation and the ΔΔCt method.
You can enter the slope from your instrument software, or paste the Ct values from a dilution series and let the calculator fit the standard curve, report R² and convert the slope into efficiency.
How to Use the qPCR Efficiency Calculator
- Prepare a serial dilution of your template (usually 10-fold) and run each point in replicate.
- Choose From Slope if your software already gives the slope of Ct versus log10 quantity.
- Or choose From Ct Values and enter the mean Ct of each dilution, highest concentration first.
- Enter the dilution factor between points.
- Press Calculate to get efficiency, slope, R² and amplification factor.
qPCR Efficiency Formula
The qPCR efficiency calculator uses the slope of the standard curve, where Ct is plotted against the log10 of the starting quantity.
E (%) = (10−1/slope − 1) × 100- Slope – from the linear fit of Ct vs log10(quantity)
- 10−1/slope – amplification factor per cycle (2.0 = perfect doubling)
- R² – how well the points fit a straight line
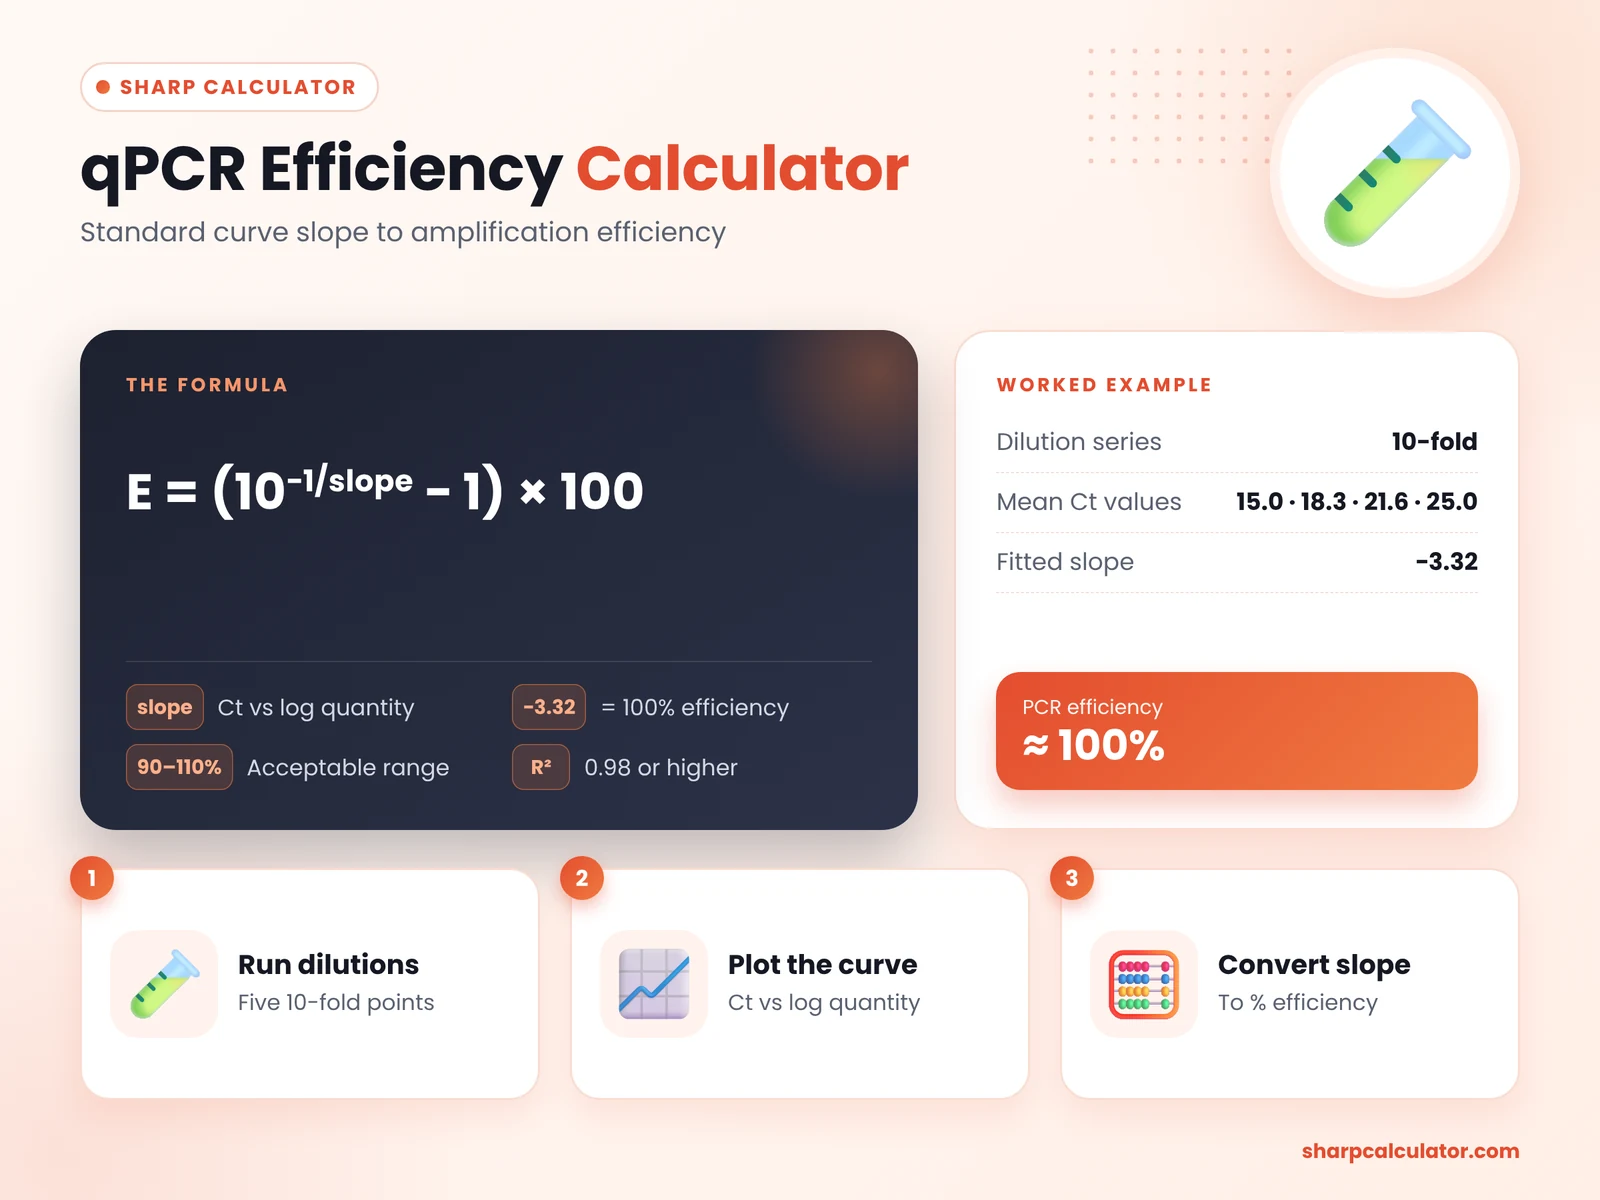
A perfect reaction has a slope of −3.32, because log10(2) = 0.301 and 1 ÷ 0.301 = 3.32 cycles per ten-fold change. Steeper slopes mean lower efficiency; shallower slopes suggest efficiency above 100 %, often caused by inhibition at high concentrations or pipetting errors.
Worked example
A 10-fold dilution series gives mean Ct values of 15.00, 18.32, 21.64 and 24.96.
The fitted slope is −3.32 with R² = 1.000, so efficiency = (101/3.32 − 1) × 100 ≈ 100 %. These primers are suitable for ΔΔCt analysis.
How to Interpret qPCR Efficiency
Most guidelines, including the MIQE recommendations, accept efficiencies between 90 % and 110 % with an R² of at least 0.98. When comparing a target gene with a reference gene using ΔΔCt, both assays should have similar efficiencies, ideally within 5 % of each other. If not, use an efficiency-corrected model such as the Pfaffl method.
Always report efficiency together with the slope, R² and dynamic range of your standard curve. These details allow others to judge the quality of your assay and are recommended by the MIQE guidelines for publishing qPCR data.
If efficiency falls outside the accepted range, try redesigning primers, testing an annealing temperature gradient or cleaning up the template to remove inhibitors. Re-running the standard curve after each change and entering the new slope above shows straight away whether the assay has improved enough for reliable quantification. Keeping a record of each primer pair’s efficiency also lets you choose the right quantification model later and makes it easier to compare results between experiments run weeks or months apart.
| Efficiency | Slope | Interpretation |
|---|---|---|
| < 90% | below −3.58 | Poor primer design or inhibitors |
| 90 – 110% | −3.58 to −3.10 | Acceptable |
| ≈ 100% | −3.32 | Ideal doubling |
| > 110% | above −3.10 | Inhibition, pipetting error or primer dimers |
qPCR Efficiency and the ΔΔCt Method
The popular 2−ΔΔCt method assumes that both the target and reference genes amplify at close to 100 % efficiency. If one assay runs at 92 % and the other at 104 %, fold-change estimates drift further from the truth as Ct differences grow. Before relying on ΔΔCt, run a standard curve for each primer pair and use this qPCR efficiency calculator to confirm that efficiencies are similar. If they are not, the Pfaffl method uses the measured efficiencies directly: ratio = EtargetΔCt target ÷ ErefΔCt ref.
Troubleshooting Low or High Efficiency
Low efficiency (below 90 %) usually points to poor primer design, a long amplicon, secondary structure in the template or suboptimal annealing temperature. Redesign primers to give a 70–200 bp product, test an annealing gradient and check primer concentration.
High efficiency (above 110 %) is most often caused by PCR inhibitors carried over from extraction, which delay Ct in concentrated samples and flatten the curve. Diluting the template, cleaning up the nucleic acid or removing the most concentrated standard often brings the value back into range. Primer dimers detected in the melt curve can also inflate apparent efficiency in SYBR Green assays.
Tips for Accurate Results
- Use at least five points.A wide dynamic range of five or more dilutions gives a more reliable slope.
- Run replicates.Triplicates at each dilution reveal pipetting problems and outliers.
- Exclude bad points.Drop the most concentrated point if it shows inhibition, or the most dilute if Ct values scatter.
- Check the melt curve.A single sharp peak confirms one specific product and no primer dimers.
- Mix thoroughly.Vortex and spin each dilution before taking the next aliquot.
- Use fresh dilutions.Low-concentration standards lose template to tube walls over time.
Why PCR Efficiency Matters
Quantification assumes a known amplification rate. If efficiency is 90 % instead of 100 %, a 10-cycle difference represents a 6.1-fold change instead of 10-fold – a large error in gene expression studies. Measuring efficiency with a qPCR efficiency calculator validates new primers, supports MIQE-compliant reporting and helps you choose the right quantification model.
Who Can Use This Tool?
This tool is designed for molecular biologists, gene expression researchers, diagnostic assay developers and students learning real-time PCR. It works on any device with no installation.
Note: This qPCR efficiency calculator is for research use. Follow MIQE guidelines and your instrument manufacturer’s recommendations when validating assays.
Frequently Asked Questions
How do you calculate qPCR efficiency?
Plot Ct against log10 of the starting quantity, find the slope, then use E = (10^(−1/slope) − 1) × 100.
What is a good qPCR efficiency?
Between 90 % and 110 %, with a standard curve R² of 0.98 or higher.
What slope equals 100% efficiency?
A slope of −3.32 corresponds to 100 % efficiency, meaning the product doubles every cycle.
Why is my efficiency over 100%?
Common causes are inhibitors in concentrated samples, pipetting errors, primer dimers or non-specific amplification.
How many dilution points do I need?
At least five points over a 10⁴–10⁵-fold range give a dependable estimate.
Can I use 2-fold or 5-fold dilutions?
Yes. Enter the dilution factor you used; the calculator adjusts the x-axis accordingly.